Leverage Mechanics: What 1:100 Actually Means for Your Account
Leverage is the most misunderstood number on your trading platform. Here is what it does to margin, exposure, and risk — with a worked example ahead of a busy central-bank week.
Ask ten retail traders what "1:100 leverage" means, and you will get ten different answers. Some think it multiplies their profit. Some think it multiplies their risk by 100. Some think it is a loan the broker extends. None of those framings is quite right, and the confusion matters — especially in a week that includes the RBNZ, the Bank of Canada, euro-area CPI, and US ISM Manufacturing, all capable of moving currency pairs several hundred pips inside a single session.
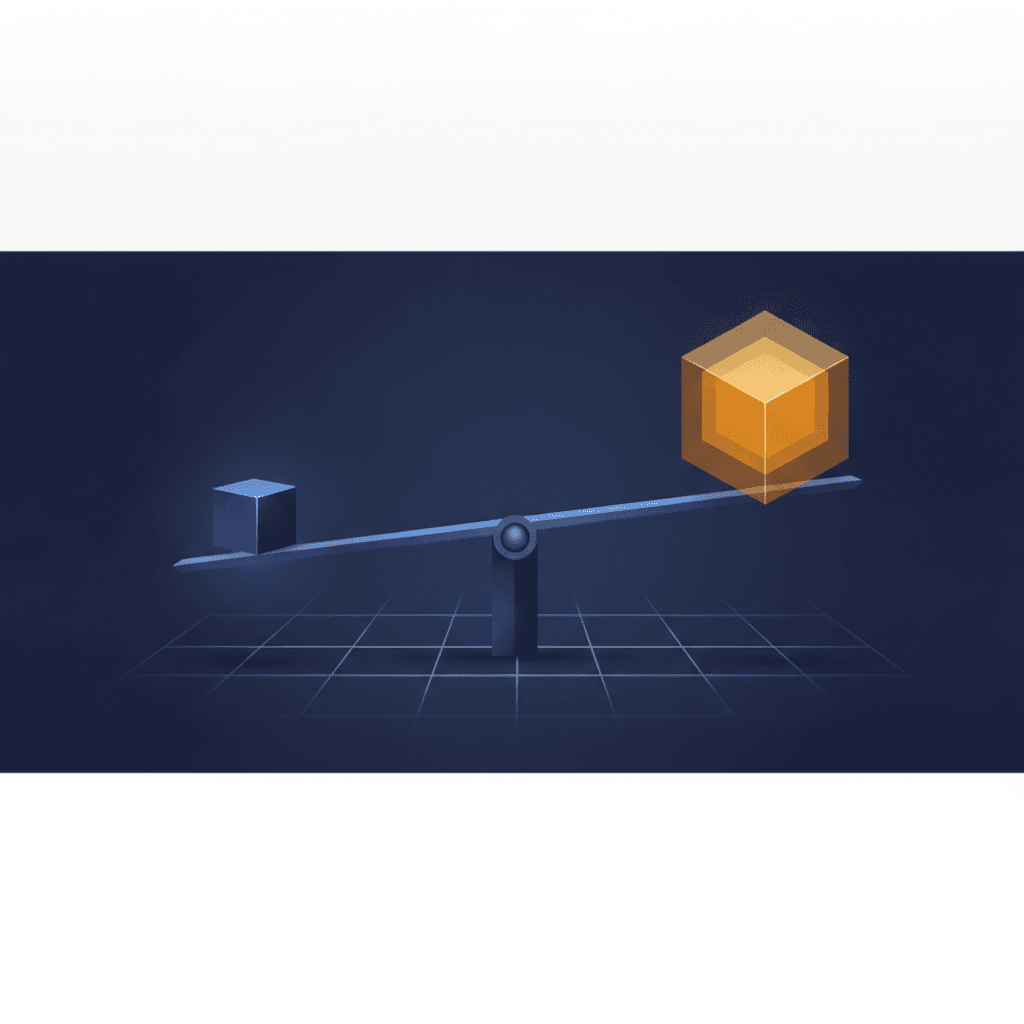
Leverage is not a profit multiplier and it is not a loan in the everyday sense. It is a ratio that tells you how much market exposure your deposited margin can control. Everything else — the P&L swings, the margin calls, the survival of your account through a data spike — flows from that one number and how you size around it.
What Leverage Actually Is
Leverage expresses the relationship between the notional value of a position and the margin required to hold it. A leverage ratio of 1:100 means that for every 1 unit of margin you post, you can control 100 units of notional exposure. On a standard 100,000-unit EURUSD lot, that translates to roughly 1,000 units of margin locked up while the trade is open.
That locked-up amount is not a fee and it is not spent. It is set aside as collateral. When you close the position, the margin is released back into your free balance, adjusted for whatever profit or loss the trade produced.
The important shift in thinking is this: leverage does not create risk on its own. Position size creates risk. Leverage just changes how much margin that position size consumes. A trader using 1:500 leverage but trading 0.01 lots is running less risk than a trader on 1:30 leverage trading 5 lots. The ratio on your account settings tells you what is possible, not what is prudent.
Margin, Free Margin, and the Margin Level
Once a position is open, your platform shows several balance figures that all describe slightly different things:
- Balance — cash in the account, ignoring open trades.
- Equity — balance plus or minus floating P&L on open positions.
- Used margin — the collateral locked against your open trades.
- Free margin — equity minus used margin. This is what you can deploy into new positions or absorb as loss.
- Margin level — equity divided by used margin, expressed as a percentage.
Margin level is the number that determines whether your account stays open through a volatile print. Most brokers, including us, enforce a margin call threshold and a stop-out threshold. When margin level falls to the stop-out level, the platform starts closing positions automatically — largest loser first — until the level recovers. It is not a punishment. It is the mechanism that stops an account from going negative when a market gaps.
A Worked Example (For Illustration)
Assume a trader deposits 2,000 USD into an account with 1:100 leverage. They open one standard lot of EURUSD at 1.1000. Numbers below are illustrative, not live quotes.
- Notional exposure: 100,000 × 1.1000 = 110,000 USD
- Required margin at 1:100: 1,100 USD
- Free margin after opening: 2,000 − 1,100 = 900 USD
- Pip value on a standard lot: roughly 10 USD per pip
That 900 USD of free margin absorbs 90 pips of adverse movement before the account approaches the margin call zone. Wednesday's RBNZ decision — with the market pricing a 25 bp hike from 2.50% to 2.75% — can easily move NZD crosses by more than 90 pips in the first ten minutes. The same lot size on the same 2,000 USD account, but on a different pair with a similar move, would produce the same outcome.
Now flip the leverage. Same trader, same deposit, same one-lot position, but the account is set to 1:30 (a common cap under some regulatory frameworks). Required margin becomes roughly 3,667 USD. The account cannot even open the trade — the margin requirement exceeds the balance. Higher leverage did not make the trade riskier in terms of pip exposure. It made it possible. The risk was always defined by the one-lot size.
This is the piece most new traders miss. Two accounts with identical positions have identical P&L per pip, regardless of the leverage ratio. What differs is how much cushion — free margin — remains to absorb drawdown before automatic close-outs begin.
Why the Ratio Still Matters
If leverage does not create risk directly, why care about the ratio at all? Three reasons.
First, it defines your buffer. Higher leverage means less margin locked per position, which means more free margin to weather a spike. That cuts both ways: it lets a well-sized trade survive noise, and it lets an oversized trade run further into loss before the platform intervenes.
Second, it shapes behaviour. A ratio of 1:500 makes it psychologically easy to open positions that a lower ratio would refuse outright. The temptation to "use the leverage available" is one of the most reliable ways new accounts blow up. The available leverage is a ceiling, not a target.
Third, it interacts with execution conditions. During news events — Tuesday's euro-area CPI flash at 05:00 GMT+3, Wednesday's ADP at 08:15 GMT+3, the RBNZ statement at 22:00 GMT+3 — spreads widen and liquidity thins. Slippage on stops can push realised loss beyond the level you planned for. An account running on thin free margin going into that kind of print has almost no room to absorb the surprise.
The Takeaway
Before you place a trade, work out two numbers: the pip value of your intended position, and the number of adverse pips your free margin can absorb before you reach stop-out. If those numbers do not match your view on where a reasonable stop belongs, the position is too large — not because leverage is dangerous, but because the size chosen against that leverage does not leave room for the market to breathe.
Leverage is a tool for capital efficiency. Sizing is where risk is actually decided. If you want to dig deeper into how we handle margin, stop-out, and execution around scheduled events, our education hub covers each one in detail.
Keep reading
More Insights
 Market Education
Hedging Explained: Why Locking a Position Isn't the Same as Closing It
Opening an opposite trade freezes your P&L but not your costs, your margin, or your decision — here is what a hedge actually does to an account.
October 12, 2026
 Industry Insights
Bitcoin and Ether Extend Correction as Yields and Oil Reprice Risk
A September rally that had already lost momentum met a rates-and-energy shock this week, and ETF redemptions plus leveraged liquidations did the rest.
October 9, 2026
 Industry Insights
Weekly Sentiment: Physical Supply Shocks, Crypto De-Risks, Tokenization Builds
A defensive close to the week as two unrelated supply disruptions repriced crude, digital assets drifted toward a well-known anniversary, and AI-adjacent equities thinned out.
October 9, 2026